- Visibility 101 Views
- Downloads 7 Downloads
- DOI 10.18231/j.idjsr.2024.007
-
CrossMark

Comparison of facial attractiveness with golden proportion anthropometrically in young North Indian females
- Author Details:
-
 Gunjan Aneja
-
Shruti Mittal *
-
Astitav Mittal
-
Prerna Hoogan Teja
-
Mahak Gagain
-
Aashee Verma
Introduction
Facial beauty is a positive, pleasant sensation perceived by an individual but is a subjective value. Its perception is affected by the environment in which one is raised, its culture, tradition, education, and genes.[1] For many decades, the concept of beauty has been changing. In spite of the fact that fashion, tastes, and standards of beauty change from time to time, there seems to be certain facial proportions and relationships that provide a basis for the diagnosis and treatment planning according to the facial form. A face is perceived as beautiful if it shows harmonious features when facial components are proportional and balanced. [2] A beautiful human face can attract charm, brighten or seduce. According to common belief a name may be forgotten but not a face. [3] Anthropology is an art and science used for measuring the soft tissue proportions,[2] studying of human face and the assessing facial dimensions.
Anthropology comes from the words “anthropos,” meaning man and “logos,” meaning knowledge.[4] The ancient Egyptians dealt with harmonious (attractive) proportions of the face and body. Many norms and standards have been developed which defines facial attractiveness. The most famous among them is the facial golden proportion. [5] The divine proportions, or the golden ratio, were of utmost importance in Greek art and architecture. Phidias, a Greek sculptor, used the golden ratio number 1.618 called as Phi. [6] Leonardo da Vinci, illustrated the proportions of the face as related to golden ratio which showed balance and harmony among them. [7] Ricketts found a relationship between divine proportions and facial beauty, as divine proportions were esthetically pleasing. Letter Phi has become a symbol of harmony, balance, and beauty. [6]
Divine proportions result from a specific geometric sectioning of a distance: a line (AB) is sectioned at point C in accordance with the golden ratio when the 2 subsections (AC to CB) correspond to each other, as does the whole distance AB to the section AC. This relationship is called phi (ϕ=1.618). [6]
Materials and Methods
A total of 324 young adult females of north Indian origin in the age range of 18-26 year were scrutinized for the present study. The sample size was determined using G*Power 3.1 software with a 5% level of significance, power = 80%, and effect size of 0.38. Total 120 subjects were selected who met the inclusion criteria which included female subjects of north Indian origin with ancestry up to at least two generations to minimize the variability from racial or geographical differences. Subjects with fully erupted permanent dentition up to second molars, without any marked facial asymmetry. None of them had any previous history of orthodontic and orthopaedic treatment. Subjects were not medically compromised. Subjects with any craniofacial abnormality or history of facial or dental trauma or facial surgery were excluded from the present study. An informed written consent was taken from each subject at the start of the study.
The subject was seated on dental chair. Soft tissue anatomical points required for anthropological measurements were assessed and small slip of micropore tape was pasted on it. Measurements were done directly on the patient’s face using classic methods of physical anthropology using standard instruments, as described by Farkas LG2. Following calibrated calipers were used for measurements.
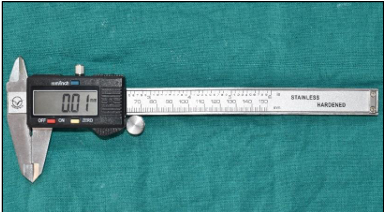
Sliding caliper ([Figure 1])
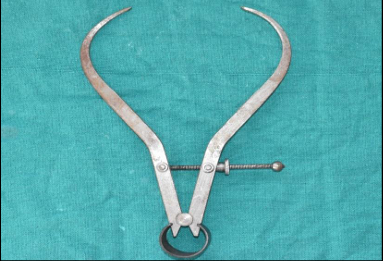
Spreading caliper ([Figure 2])
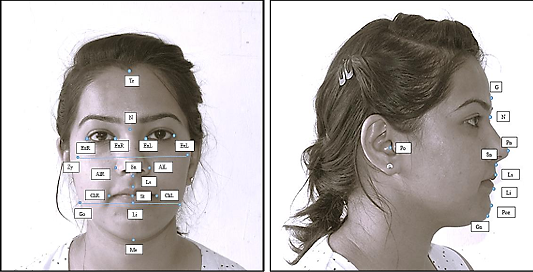
Anthropometric landmarks used in this study were marked on the face, eyes, nose and lips are as shown in ([Figure 3], [Table 1])[8], [9]
|
1. Tr: trichion – midpoint of the forehead at the level of hairline |
|
|
2. N: skin nasion (constructed point) –midpoint of the nasal root and the nasofrontal suture. |
|
|
3. Ex: exocanthion – outermost point commissural of eye fissure |
|
|
4. En: endocanthion – innermost point commissural of eye fissure |
|
|
5. Al: alare – lateralmost point on alare conture |
|
|
6. Sn: subnasale – midpoint at the junction of nasal septum and the upper lip meet. |
|
|
7. St: stomion – midpoint at the junction of upper & lower vermillion |
|
|
8. Ch: cheilion – lateralmost point of the labial fissure |
|
|
9. Ls: labrale superior – most prominent point on the upper vermilion border |
|
|
10. Li: labrale inferior – most prominent point on the lower vermilion border |
|
|
11. Me: menton – the inferiormost midpoint on the mandibular symphysis. |
|
|
12. Gn: gnathion –point midway between menton and the pogonion. |
|
|
13. Zy: zygion –lateral most point of zygomatic arch. |
|
|
14. Go: gonion –inferiormost & posterior point on the external angle of the mandible |
|
Following facial ratios were calculated for comparison with golden ratio ([Table 2])
|
Ratio 1 N-Gn/Zy-Zy - Facial index |
|
|
Ratio 2 Ch-Ch/Zy-Zy - Mouth width to Facial width |
|
|
Ratio 3 N-Sn/Sn-Me - Upper facial height/ lower facial height |
|
|
Ratio 4 En-En/Ex-Ex - Eye index |
|
|
Ratio 5 Ex-Ex/Zy-Zy - Eye width to face width |
|
|
Ratio 6 En-En/Al-Al - Eye to nose width |
|
|
Ratio 7 Ex-En/Zy-Zy - Eye width to face width |
|
|
Ratio 8 Al-Al/N-Sn - Nose index |
|
|
Ratio 9 N-Sn/Tr-Gn - Nose to face index |
|
|
Ratio 10 Al-Al/Ch-Ch - Nose to mouth width |
|
|
Ratio 11 Sn-St/St-Gn - Upper lip to lower lip length |
|
|
Ratio 12 Ls-St/St-Li - Vermillion height of upper lip/lower lip |
|
|
Ratio 13 Go-Go/Zy-Zy - Mandibular face width |
|
|
Ratio 14 St-Gn/Go-Go - Mandibular index |
|
|
Ratio 15 Ls-Li/Ch-Ch - Lip index |
|
Grouping of sample subjects
Photographs were obtained using DSLR camera on a standardized setup. The standardized photographic setup included tripod stand at a predetermined center i.e., 6 feet. A circular flash was used as a source of light. The subject was asked to stand with their face facing the camera. The subject was positioned in natural head position (NHP). And the photograph was clicked for each subject in the frontal view. Each image was digitally scanned to a computer. The images were converted into black and white colour to avoid effect of facial complexion on the attractiveness. The images were rotated to an estimated upright head position with patient looking outward into the horizon.
After obtaining photographs of all females, it was formed into a Power Point slide show presentation. The sample classification was based on ratings of facial photographs of the subjects. Facial esthetics subjective analysis was done by selected board of judges consisting of 6 evaluators; 2 orthodontist, 2 oral surgeons and 2 laypersons from good socioeconomic status, each set of judges was one male and one female. Each evaluator received a slide show of 120 photographs. Each set of photographs was to receive just one score. Evaluators analyse the photographs to classify sample subjects according to facial attractiveness. The photograph of each subject was viewed and rated by each judge on a Visual analogue scale (VAS) that was ranged from 0 to 10 ([Figure 4]). VAS was used to rate the level of facial attractiveness (score 0, is lowest; score10, highest degree of attractiveness). From these scores, the sample was divided into three groups10,11.
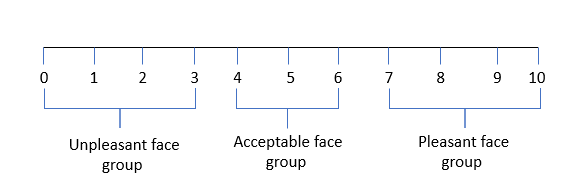
Individuals with low grades 0, 1, 2, 3 were classified as unpleasant face group (Group I); with average grades 4, 5, 6, as acceptable face group (Group II) and with high grades 7, 8, 9 and 10 as pleasant face group (Group III).
Statistical analysis
Statistical analysis was performed on version Statistical Package for Social Sciences (SPSS). The one-sample t-test was used to test whether value of facial ratios was similar to the golden proportion. The significance level used was less than 5% (p< 0.05) at a confidence level of 95%.
Results
The total sample was grouped on the basis of subjective analysis of facial esthetics by a selection board which consists of 6 judges i.e., 2 orthodontists, 2 oral surgeons, 2 laypersons with one male and one female in each category. Based on the score obtained the total sample was divided into 3 groups viz. Group I, Group II, Group III. ([Table 3] )
|
|
|
Subjects |
% |
|
Group I |
Unpleasant face group |
39 |
32.5% (33 %) |
|
Group II |
Acceptable face group |
46 |
38.33% (38%) |
|
Group III |
Pleasant face group |
35 |
29.16% (29%) |
Comparison of facial indices ratios with the golden ratio
The facial indices ratio was compared with the golden ratio in each group using one sample t – test.
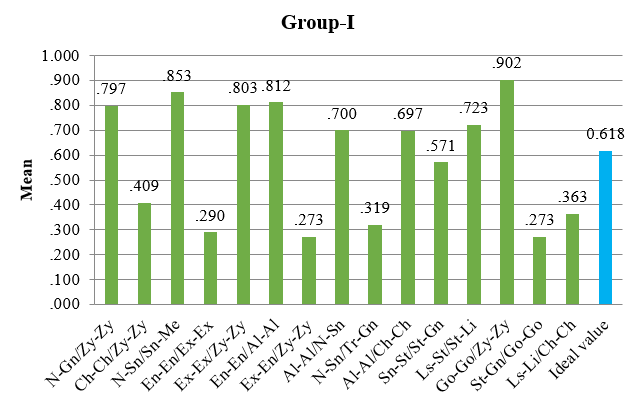
Comparison of facial indices ratio with golden ratio in group I (n=39) ([Figure 5])
Facial indices ratios of N-Gn/Zy-Zy (0.797), N-Sn/Sn-Me (0.853), Ex-Ex/Zy-Zy (0.803), En-En/Al-Al (0.812), Al-Al/N-Sn (0.700), Ls-St/St-Li (0.723), Go-Go/Zy-Zy (0.902) were greater than golden ratio.
Facial indices ratio of Ch-Ch/Zy-Zy (0.409), En-En/Ex-Ex (0.290), Ex-En/Zy-Zy (0.273), N-Sn/Tr-Gn (0.319), Sn-St/St-Gn (0.571), St-Gn/Go-Go (0.273), Ls-Li/Ch-Ch (0.363) show ratio less than golden ratio.
Facial indices ratio Al-Al/ Ch-Ch (0.697) show comparable ratio to the golden proportion.
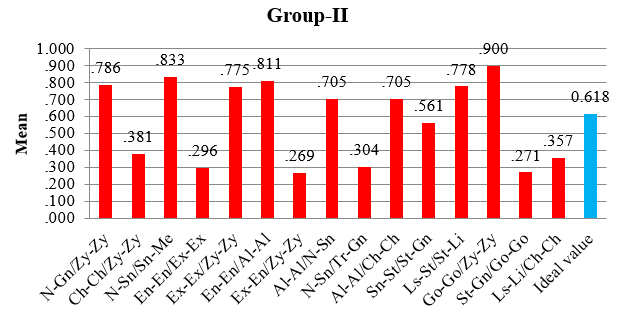
Comparison of facial indices ratio with golden ratio in group II (n=46) ([Figure 6])
Facial ratios of N-Gn/Zy-Zy (0.786), N-Sn/Sn-Me (0.833), Ex-Ex/Zy-Zy (0.775), En-En/Al-Al (0.811), Al-Al/N-Sn (0.705), Al-Al/ Ch-Ch (0.705), Ls-St/St-Li (0.778), Go-Go/Zy-Zy (0.900) were greater than golden ratio.
Facial ratio Ch-Ch/Zy-Zy (0.381), En-En/Ex-Ex (0.296), Ex-En/Zy-Zy (0.269), N-Sn/Tr-Gn (0.304), Sn-St/St-Gn (0.561), St-Gn/Go-Go (0.271), Ls-Li/Ch-Ch (0.357) show ratio less than golden ratio.
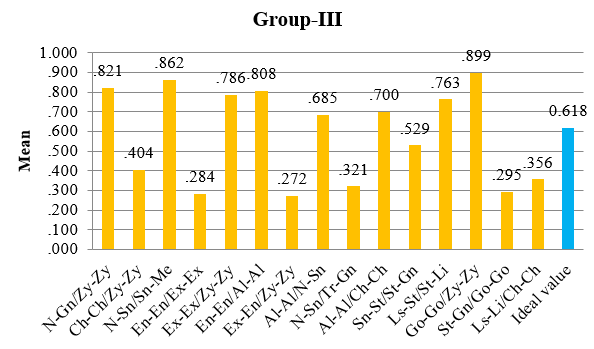
Comparison of facial indices ratio with golden ratio in group III (n=35) ([Figure 7])
Facial ratios of N-Gn/Zy-Zy (0.821), N-Sn/Sn-Me (0.862), Ex-Ex/Zy-Zy (0.786), En-En/Al-Al (0.808), Al-Al/ Ch-Ch (0.700), Ls-St/St-Li (0.763), Go-Go/Zy-Zy (0.899) were greater than golden ratio.
Facial ratio Ch-Ch/Zy-Zy (0.404), En-En/Ex-Ex (0.284), Ex-En/Zy-Zy (0.272), N-Sn/Tr-Gn (0.321), Sn-St/St-Gn (0.529), St-Gn/Go-Go (0.295), Ls-Li/Ch-Ch (0.356) show ratio less than golden ratio.
Facial ratio Al-Al/ N-Sn (0.685) show comparable ratio to the golden proportion.
Discussion
Orthodontists have a great interest in facial beauty, although, over time, the relative importance of esthetics has increased and decreased in relation to other considerations. Facial esthetics is the reason for orthodontic treatment. [10] Perceptions of facial beauty are multifactorial, with genetic, environmental, and cultural foundations. [11] Beauty can be defined as a combination of qualities that give pleasure to the senses or to the mind. [12]
In a study by Khan et al [5] facial divine proportion evaluation in North Indian population in attractive females’ group, five out of seven proportions (TR‑ME: LC‑ME, LC‑ME: TR‑LC, LC‑CH: CH‑ME, LC‑LN: LN‑CH) were close to golden proportion. This supports our study. Mizumoto et al[13] in his study on Japanese women found similar results.
The findings of the study to some extent agree with previous studies done by Ricketts [8], [14] who considered that the golden proportion is directly related to the facial esthetics; however, our result showed that there is no relationship between the golden proportion and beauty perception.
Burusapat and Lekdaeng [15] in their study on beautiful proportional faces concluded that facial golden ratio was not applicable in modern beautiful women. When compared with golden ratio only 3 ratios showed statistically significant results in Miss Universe Thailand and Miss Universe groups (Gn-Ch:Ch-En, En-Gn:En-Ch, and Ls-St:St-Li). All other ratios were statistically insignificant which supports the present study.
Peron APLM [16] found that none of the values showed golden proportions, whereas Me-Al/Al-Tr, for the pleasant group showed median values close to the golden ratio. Eight evaluated ratios are away from this value. Individuals that are considered as more attractive do not have more measures in golden proportion than those that are considered less attractive. In this way, it may be noted that faces considered beautiful may not display the golden proportion and vice versa, [17] and that’s way facial esthetic at the end of treatment should not always be related to the patient’s facial measurements near to the golden section.[18]
Gil [19] states that golden proportion is a translation of an assessment of beauty, based on the standards given by Ricketts. [8]
A study done by Ferring and Pancherz [6] on divine proportions in growing faces found that divine facial proportions are rarely achieved in ordinary people. For the female subjects, 10.5% and 18.1% were the average percentage deviations from the ideal values of all transverse and vertical distances, which is called as disproportion index. In the study of Heiss, who analyzed the beautiful faces of cover models, the respective deviations were only between 2.6% and 4.4% for the women. Thus, it appears that people with attractive faces show greater concordance with the divine proportions than do those with common faces which was contrary to our study.
Kiekens et al [20], [21] found a poor relationship between ratios and facial esthetics. Baker and Woods [18] found no relationship between patients treated with both orthodontic/orthognathic surgical treatment and Rickett’s golden proportion. Pre and post treatment lateral cephalograms, frontal (nonsmiling) and profile color facial photographs were taken for the study.
Pancherz et al[22] compared attractive and nonattractive patient groups and found great deviation from the golden proportion in nonattractive group. He concluded that the attractive patient group had values closer to the golden proportions, which was contrary to our findings.
A study done by M.S. Nguyen et al[23] evaluated the proportions of Vietnamese females in the frontal view and compared them to the golden proportion. He found out that the ratios of LNR-L:CHR-L:LCR-L:TSR-L were 1:1.211:2.346:2.884. Similar ratios in the Japanese sample were 1:1.183:2.422:3.786[13] & in the Indian sample, they were 1:1.261:2.466:3.448. [24] He found that in both the groups, horizontal facial proportion did not show any relationship with golden proportion, similar to our study. Concerning the vertical facial proportion, he found that the ratios of LC-ME:TR-LC, LC-ME:TR-LC, and LC-LN:LN-CH were remarkably lower as compared to the golden proportion and TR-ME:LC-ME, TR-LN:LN-ME, LN-ME:LC-LN, LC-CH:CH-ME were remarkably higher when compared to the golden proportion.
A study done by Juhi Y [25] to evaluate golden proportions in frontal view of young adult females in three groups, which were two malocclusion groups and an attractive group. They found out that ten of the 19 presumed golden proportions showed significant differences among the attractive and malocclusion groups. Similar to our study, they failed to observe any trend of either group being constantly near or equal to the ideal golden proportion. They studied that the characteristics of an attractive face may be partially governed by golden proportions but failed to correlate attractive facial features to an ideal golden number.
The indices reported show the average proportion qualities of healthy young adult faces. In facial surgery, the determination of any unusual disproportion of the face with the help of indices is invaluable both before and after the operation. [26]
Conclusions
On subjective analysis, the facial esthetic sample was classified into 32.5% as an unpleasant face group, 38.33% as an acceptable face group and 29.16% as a pleasant face group, confirming the prevalence of the facial esthetic standard.
There was no statistically significant difference in golden proportion between the unpleasant face group, the acceptable face group and the pleasant face group.
It was concluded that ideal golden proportions may partly govern the requirements of beauty; however, they have not been analogous to the beauty or facial esthetics of the pleasing or beautiful females in the present study.
Source of Funding
None.
Conflicts of Interest
No conflicts of interest.
References
- K Lipiec, WI Ryniewicz, M Groch, A Wieczorek,, JE Loster. The evaluation of anthropometric measurements of young Polish women’s faces. J Craniofac Surg 2019. [Google Scholar]
- HJ Chandra, MS Ravi, SM Sharma, BR Prasad. Standards of facial esthetics: An anthropometric study. J Maxillofac Oral Surg 2012. [Google Scholar]
- SG Arslan, C Genç, B Odabaş, J Devecioğlu Kama. Comparison of facial proportions and anthropometric norms among Turkish young audits with different types. Aesthetic Plast Surg 2008. [Google Scholar]
- ZH Prasojo. Introduction to anthropology. Al-Albab 2013. [Google Scholar]
- NA Khan, A Nagar, P Tandon. Evaluation of facial divine proportion in North Indian population. Contemp Clin Dent 2017. [Google Scholar]
- V Ferring, H Pancherz. Divine proportions in the growing face. Am J Orthod Dentofacial Orthop 2008. [Google Scholar]
- A Rossetti, MD Menezes, R Rosati, VF Ferrario, C Sforza. The role of the golden proportion in the evaluation of facial esthetics. Angle Orthod 2013. [Google Scholar]
- RM Ricketts. The biologic significance of the divine proportion and Fibonacci series. Am J Orthod 1982. [Google Scholar]
- A Jacobson. . Radiographic Cephalometry: From basics to video imaging. 1st edn. 1995. [Google Scholar]
- N Wahl. Orthodontics in 3 millennia. Chapter 1: Antiquity to the mid-19th century. Am J Orthod Dentofacial Orthop 2005. [Google Scholar]
- FB Naini, JP Moss. Three-dimensional assessment of the relative contribution of genetics and environment to various facial parameters with the twin method. Am J Orthod Dentofacial Ortho 2004. [Google Scholar]
- D Hume. Of Tragedy. Essays, Moral, Political, and Literary 1963. [Google Scholar]
- Y Mizumoto, T Deguchi- Sr, KW Fong. Assessment of facial golden proportions among young Japanese women. Am J Orthod Dentofacial Orthop 2009. [Google Scholar]
- RM Ricketts. Divine proportion in facial esthetics. Clin Plast Surg 1982. [Google Scholar]
- C Burusapat, P Lekdaeng. What is the most beautiful facial proportion in the 21st century? Comparative study among Miss Universe, Miss Universe Thailand, Neoclassical canons, and facial golden ratios. Plast Reconstr Surg Glob Open 2019. [Google Scholar] [Crossref]
- APLM Peron, IC Morosini, KR Correia. Photometric study of divine proportion and its correlation with facial attractiveness. Dental Press J Orthod 2012. [Google Scholar]
- BW Baker, MG Woods. The role of the divine proportion in the esthetic improvement of patients undergoing combined orthodontic/orthognathic surgical treatment. Int J Adult Orthodon Orthognath Surg 2001. [Google Scholar]
- TL Shell, MG Woods. Facial aesthetics and the divine proportion: a comparison of surgical and non-surgical Class II treatment. Aust Orthod J 2004. [Google Scholar]
- CTLA Gil. . Proporção áurea craniofacial 2001. [Google Scholar]
- RM Kiekens, AM Kuijpers-Jagtman, MA Van’t Hof, BE Van’t Hof, H Straatman, JC Maltha. Facial esthetics in adolescents and its relationship to “ideal” ratios and angles. Am J Orthod Dentofacial Orthop 2008. [Google Scholar]
- RM Kiekens, AM Kuijpers-Jagtman, MA Van’t Hof, BE Van’t Hof, JC Maltha. Golden proportions as putative predictors of facial esthetics in adolescents. Am J Orthod Dentofacial Orthop 2008. [Google Scholar]
- H Pancherz, V Knapp, C Erbe, AM Heiss. Divine proportions in attractive and nonattractive faces. World J Orthod 2010. [Google Scholar]
- MS Nguyen, M Saag, VN Le, TT Nguyen, BB Nguyen, T Jagomagi. The golden proportion in facial soft-tissues of Vietnamese females. Stomatologija 2016. [Google Scholar]
- LN Sunilkumar, KS Jadhav, G Nazirkar, S Singh, PS Nagmode, FM Ali. Assessment of Facial Golden Proportions among North Maharashtrian Population. J Int Oral Health 2013. [Google Scholar]
- Y Juhi, A Rajiv. Golden proportions as predictors of attractiveness and malocclusion. Indian J Dent Res 2014. [Google Scholar]
- LG Farkas, TA Hreczko, JC Kolar. Vertical and horizontal proportions of the face in young adult North American Caucasians: revision of neoclassical canons. Plast Reconstr Surg 1985. [Google Scholar]